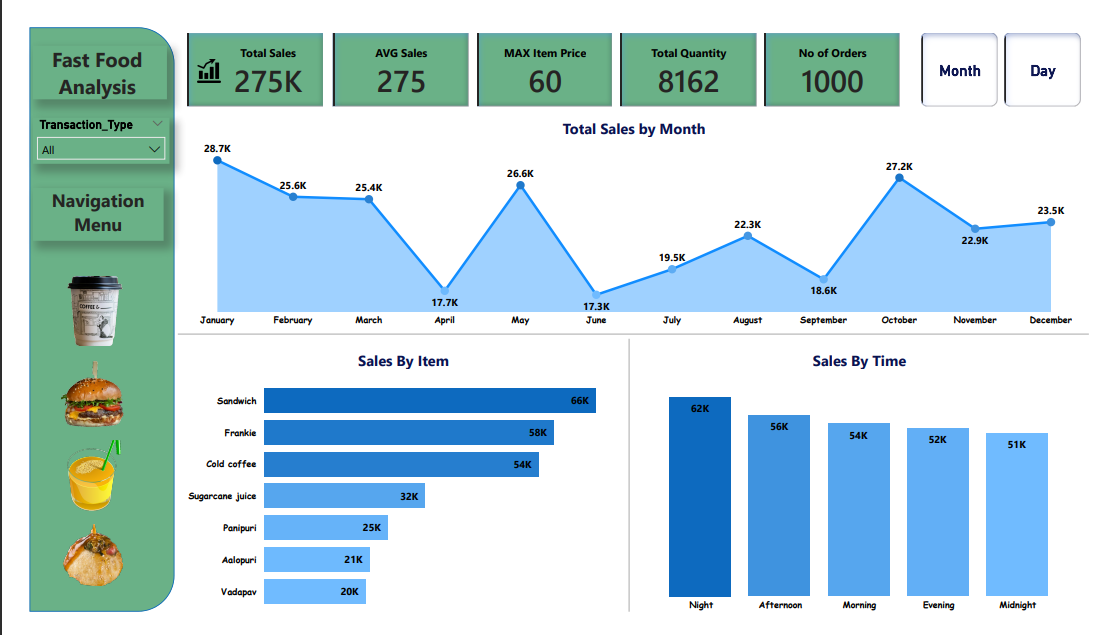
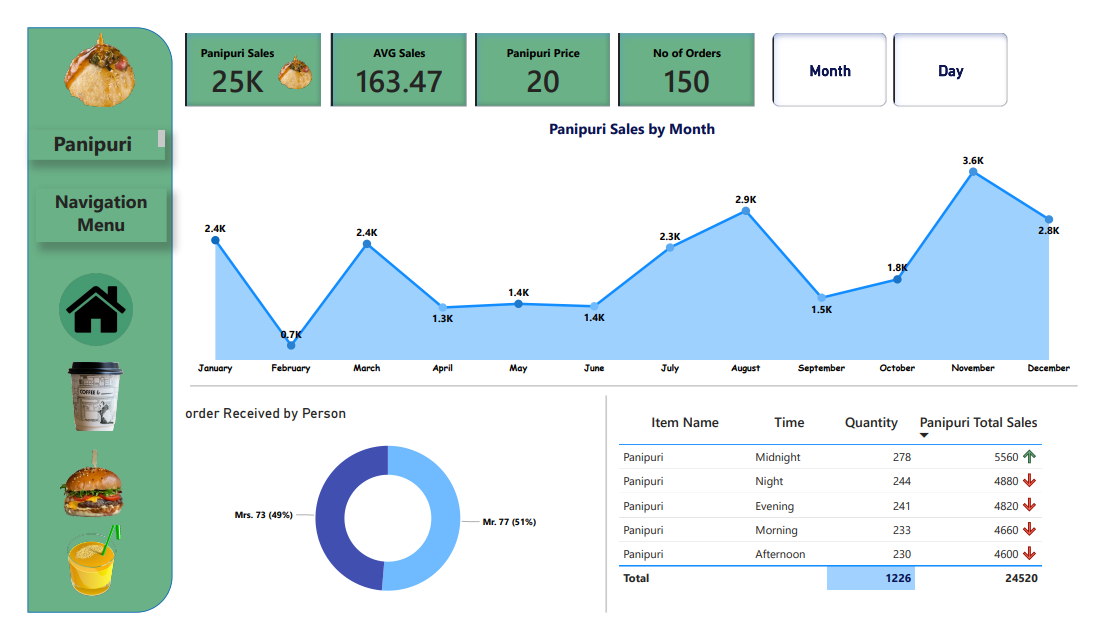
Project Overview
This project involved creating a comprehensive analysis of fast food sales data using Power BI, alongside SQL for data validation and accuracy checks. The result was a series of detailed dashboards that provided deep insights into sales trends and performance.
The Creation Process
Initially, I aimed to create a single report, but as I explored the data, I recognized the potential to expand it into multiple dashboards. I created 5 distinct dashboards, each focusing on different aspects of the data. The challenge of inconsistent date formats—where some dates were formatted as 01-01-20xx and others as 01/01/20xx—was resolved by replacing slashes with dashes directly in Excel and Power BI queries. SQL was then used to validate the accuracy of the KPIs, ensuring that each visual and metric matched the underlying data accurately.
Challenges and Solutions
One of the main challenges was managing the inconsistent date formats. This was resolved by modifying the date values directly in Excel and Power BI, ensuring uniformity. SQL was crucial in validating these changes, helping to confirm that the calculated KPIs aligned with the expected results, providing confidence in the final reports.
Key Learnings
This project enhanced my skills in data cleaning, DAX measures, SQL validation, and creating interactive Power BI dashboards. Regular updates on Twitter kept me motivated, and the feedback I received helped refine the final product.
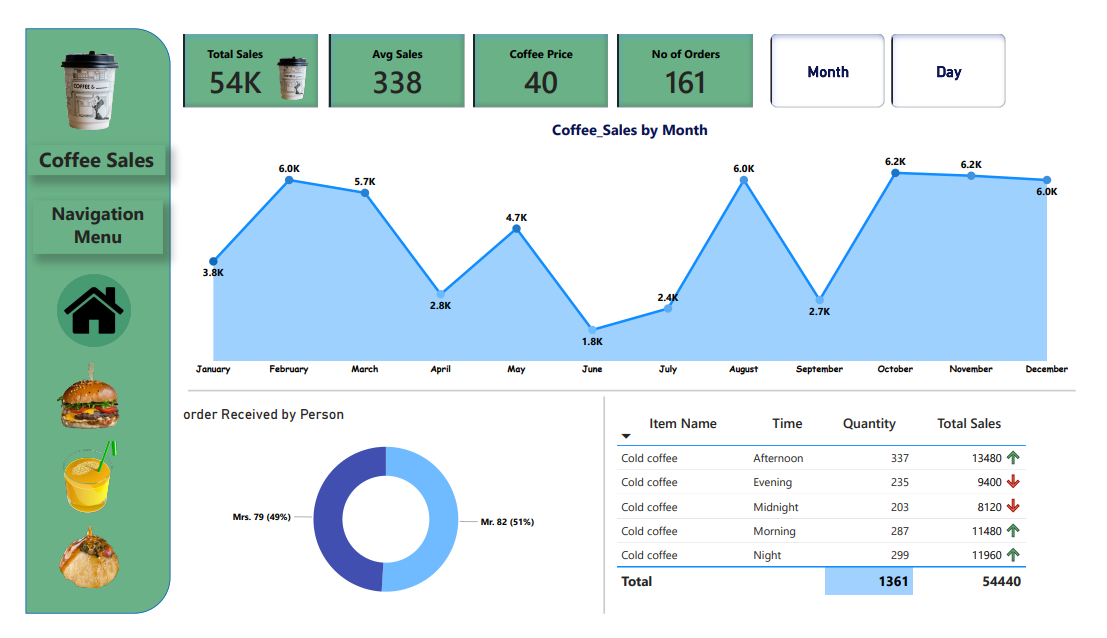
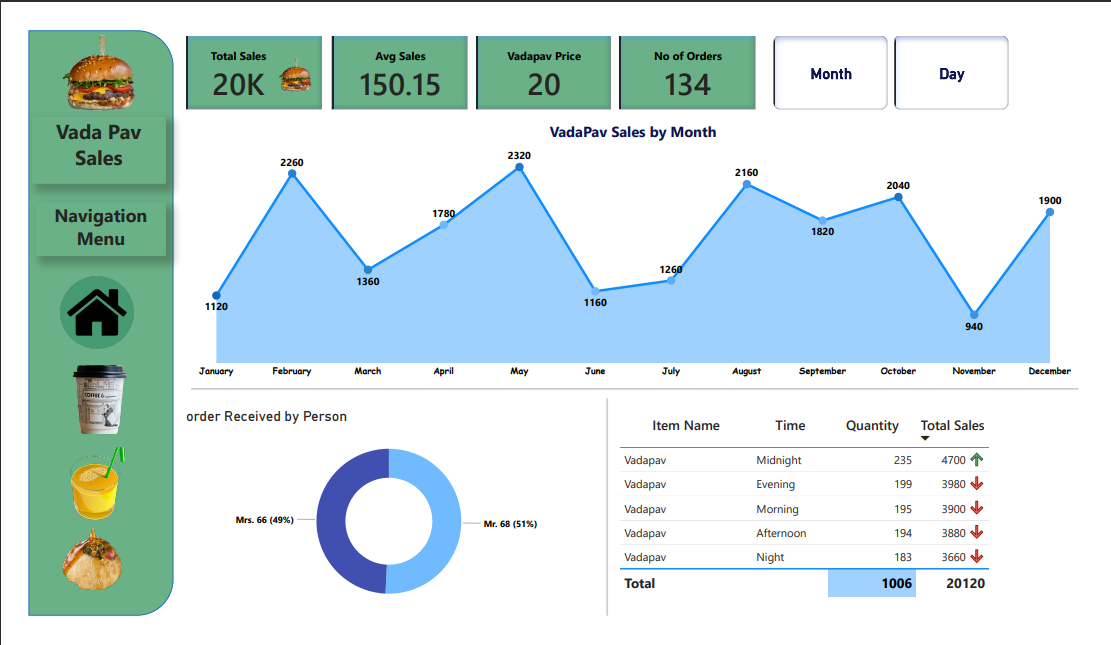
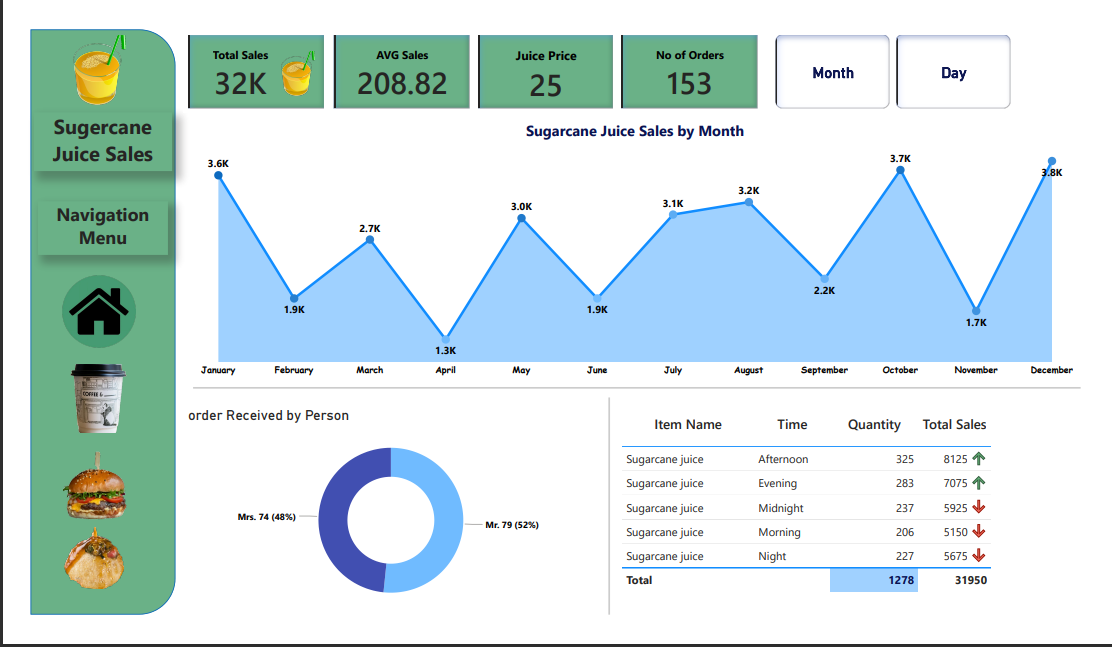
Showcase of Reports