SEP 21 2024
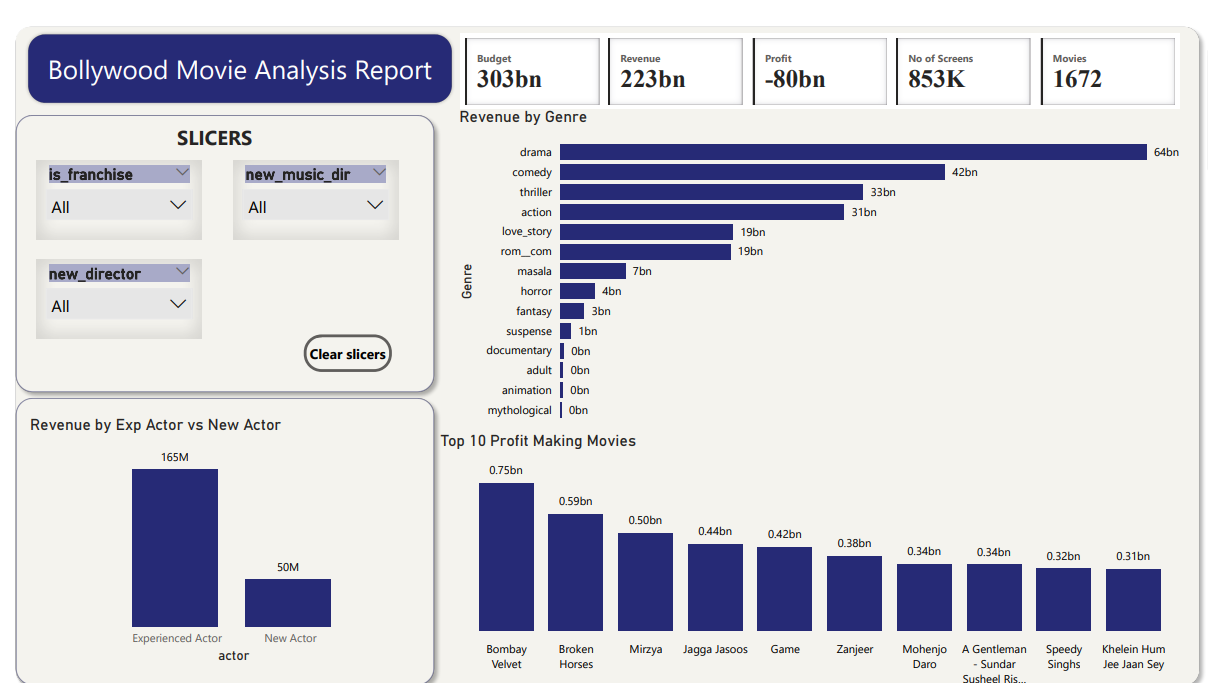
- Analyzed movie performance data using SQL, generating insights into profitability trends based on genre, release period, and star power.
- Created a Power BI dashboard to visualize KPIs such as revenue, profit, and budget, providing a clear picture of key performance metrics for decision-making.
- Evaluated the financial impact of franchise films vs. standalone movies, helping to guide future investments in franchise productions.
 SEP 09 2024
- Developed a web scraper using BeautifulSoup (bs4) to extract over 1,000 records from a custom dummy website, enhancing data extraction efficiency by 40%.
- Cleaned and transformed data with Pandas, improving data accuracy by 35% and streamlining the preprocessing workflow.
- Automated exploratory data analysis with ydata-profiling, reducing manual analysis time by 60% and providing comprehensive insights for faster decision-making.
 AUG 26 2024
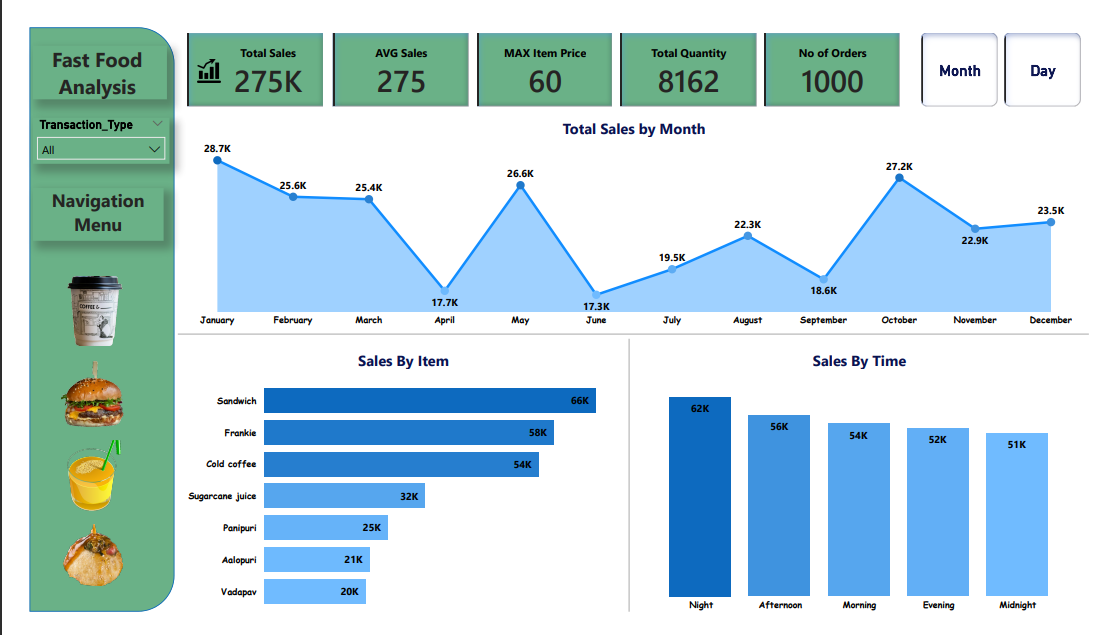
- Created a comprehensive Power BI dashboard for fast food analysis, showcasing Total Sales, Avg Sales, Max Item Price, Total Quantity, and Number of Orders.
- Developed 5 interactive dashboards with detailed DAX measures for each item, including Coffee, Vada Pav, Sugarcane Juice, and Panipuri.
- Performed extensive data validation using SQL queries to ensure accuracy and consistency of the dashboard metrics.
AUG 2 2024
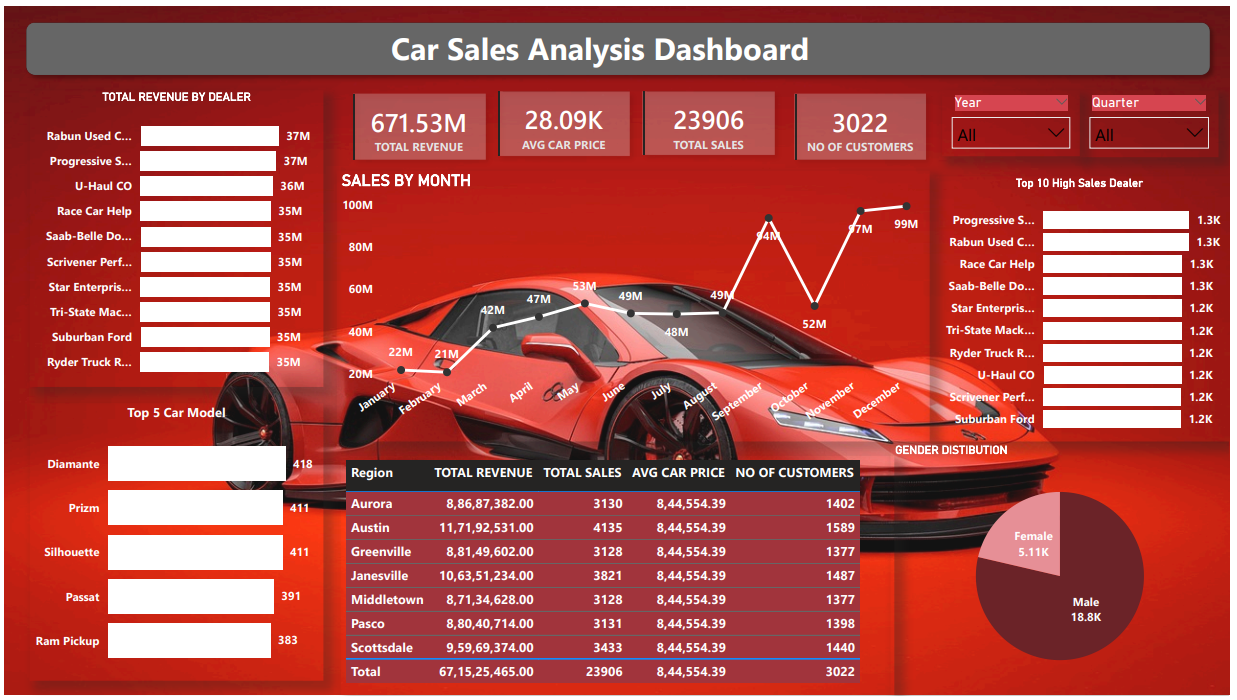
- Analyzed Amazon sales data with Python, focusing on performance and profitability.
- Developed insightful visuals with Power BI to highlight key trends and patterns.
- Leveraged group by operations extensively to uncover actionable insights and improve data analysis skills.

- Analyzed Amazon sales data with Python, focusing on performance and profitability.
- Developed insightful visuals with Power BI to highlight key trends and patterns.
- Leveraged group by operations extensively to uncover actionable insights and improve data analysis skills.
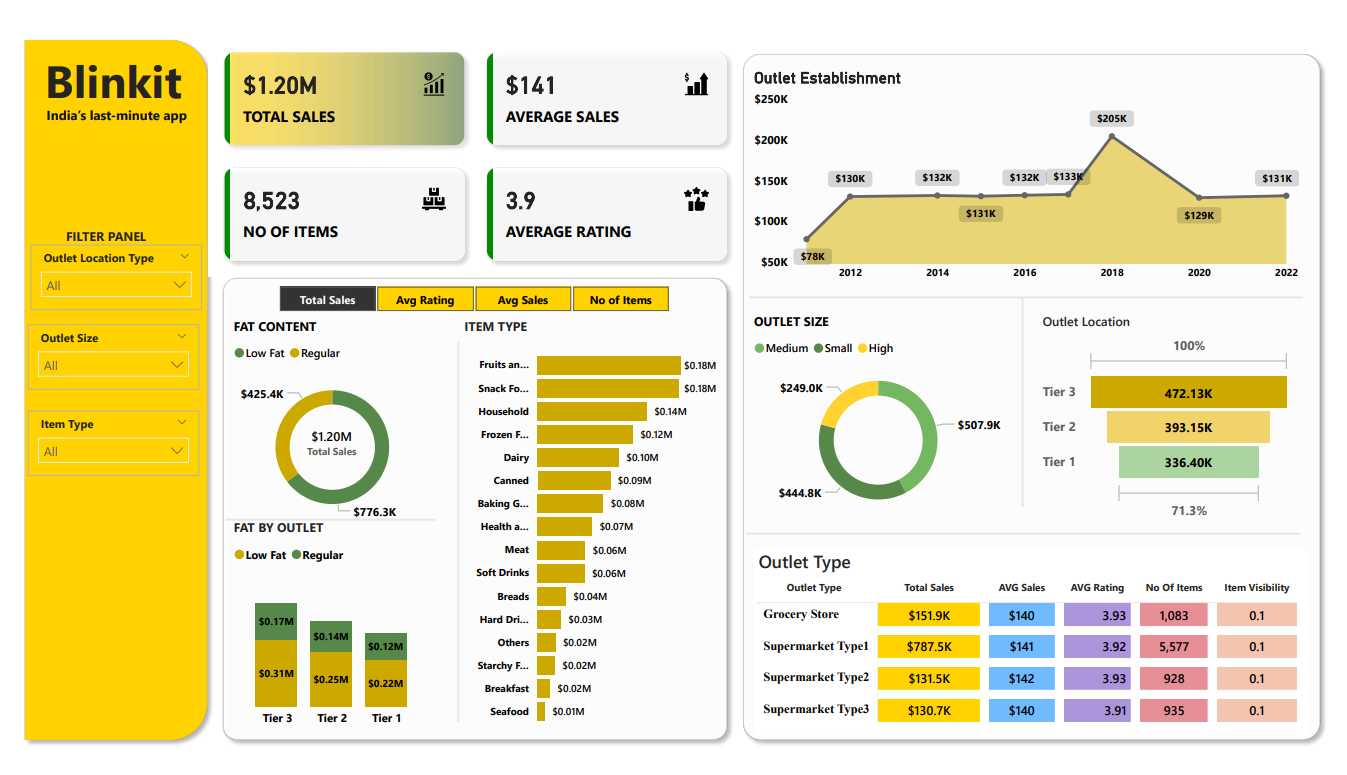
- Developed an interactive Power BI dashboard to analyze Blinkit’s sales data .
- Created visualizations for sales performance, item metrics, and outlet statistics.
- Enhanced skills in data visualization and business intelligence.
- Conducted comprehensive retail sales data analysis using SQL.
- Extracted and transformed data to generate insights on regional, product, and customer segment performance
- Generated detailed SQL reports to identify sales trends and top-performing products
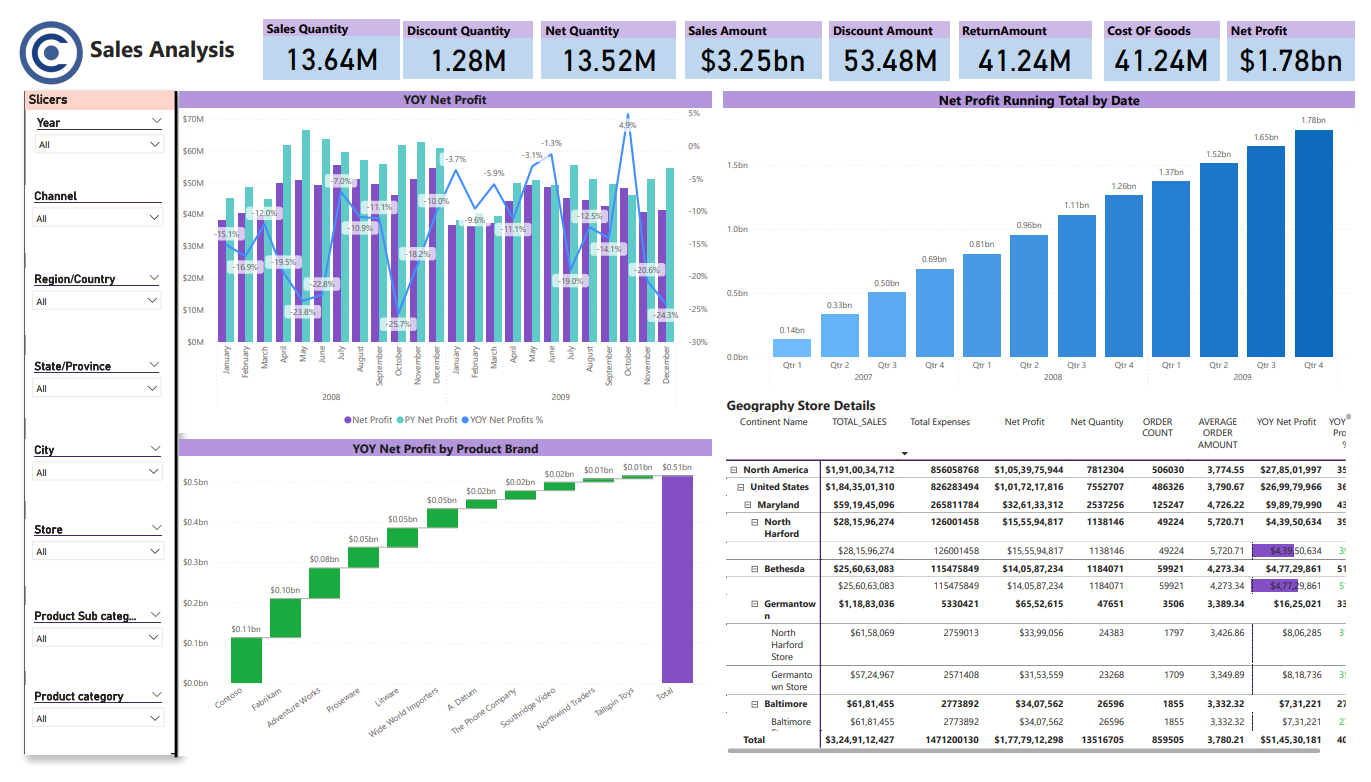
- Completed a guided project creating a comprehensive sales dashboard for Contoso using Power BI.
- Utilized advanced DAX formulas for in-depth analysis of YOY net profit and total sales quantity.
- Designed interactive visuals to provide actionable insights and enhance data understanding.
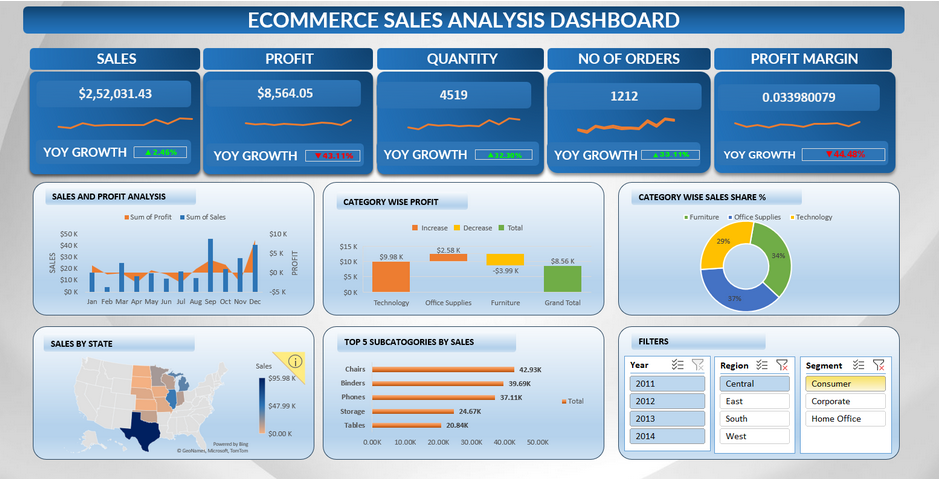
- Developed an interactive dashboard in Excel to visualize sales performance across states.
- Analyzed top-performing subcategories to identify key revenue drivers.
- Extracted insights into customer preferences and market trends to inform strategic decisions.
- Enhanced proficiency in Excel and data analysis through practical application in an eCommerce context.
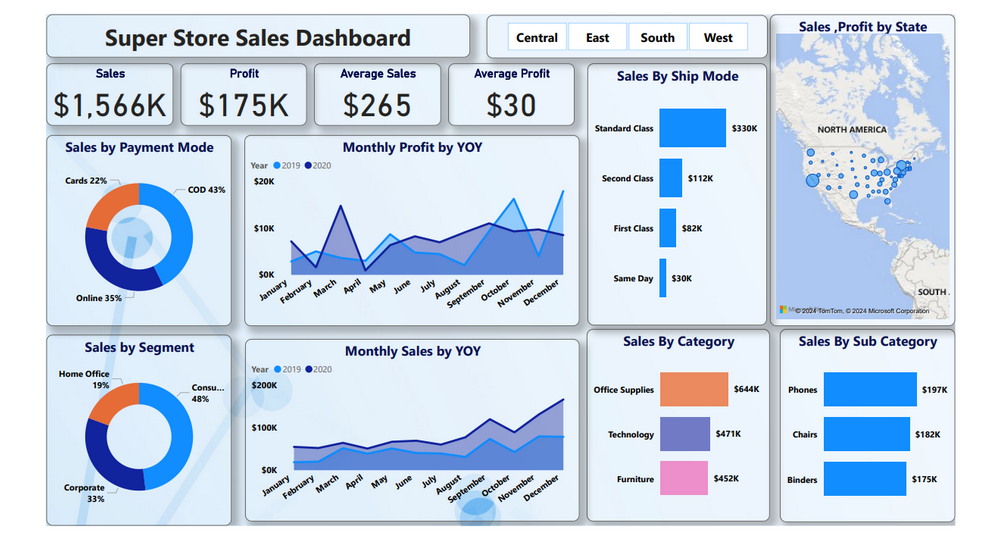
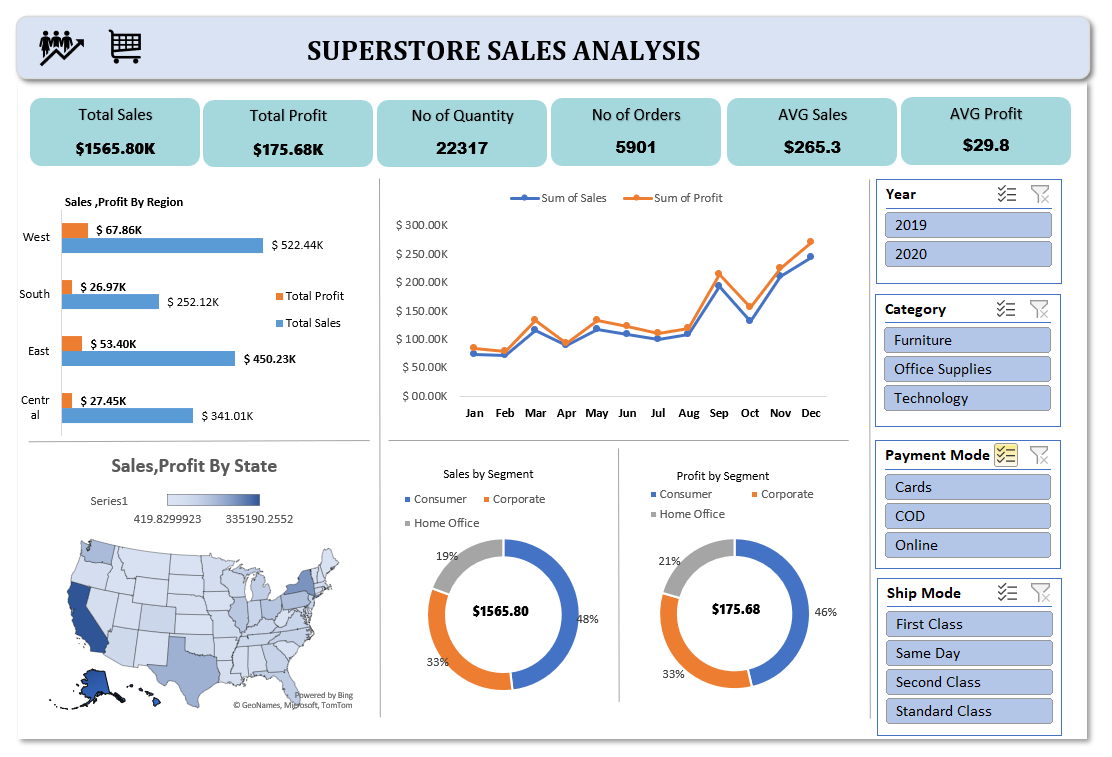
Power BI dashboard project created using the Superstore dataset. The dashboard provides visual insights into sales, profit, and performance metrics, including:
- Sales by region and segment.
- Profit analysis by category and state.
- Performance trends over time.
Power BI dashboard project created using the Superstore dataset. The dashboard provides visual insights into sales, profit, and performance metrics, including:
- Completed the COVID-19 Data Visualization Using Python project through Coursera.
- Utilized Python and libraries like Pandas and Plotly.
- Analyzed and visualized COVID-19 data for specific region.